market_report
6.1 Market

Slide 1 - Cover (TTA layout)layout: title_hero · 16:9

Snap Claim
Market Opportunity
Where we win, and why.
MK 01 / 10
Market opportunity
A $42B US LAE pool with an $11B automatable core
$42BTotal Addressable Market
US P&C loss-adjustment expense addressable by automation, about 44% of the roughly $95B annual LAE pool
Roughly $900B of direct premium at a 10.5% LAE ratio.
$11BServiceable Addressable Market
The high-frequency, low-to-mid-complexity slice where straight-through processing applies and carriers buy a platform
Personal-lines auto, homeowners, device and warranty, travel and small-commercial.
$310MServiceable Obtainable Market
Five-year obtainable, about 3% of SAM, roughly 52 carriers at forecast ACV
On the path that reaches $87.5M revenue in Year 3 and compounds from there.
MK 02 / 10
Why now
The claim just became automatable at scale
01
LAE is now a board-level line
US P&C loss-adjustment-expense ratios hit multi-year highs after the 2022 to 2024 inflation and severity shock. Cost-to-serve is now a board priority.
02
Adjudication AI crossed the bar
Document AI and LLM-based decisioning cleared the reliability threshold for straight-through processing on low-complexity claims. Automation is finally safe to ship.
03
Policyholders expect a payments app
Claims are a persistent weak point on carrier customer satisfaction. Buyers now expect a claim to feel like a payments app, not a fax, and carriers will buy that capability rather than build it.

MK 03 / 10
Business model
Two per-claim lines, both billed to the carrier
Main income
Platform and performance fees per claim
A $6.00 SaaS fee on every claim processed plus a $3.60 performance fee, roughly 25% of the $14.40 of LAE removed on each automated claim. Blended $9.60 per claim, above 74% gross margin because the marginal cost is inference and light review.
Unit economics
Unit Economics
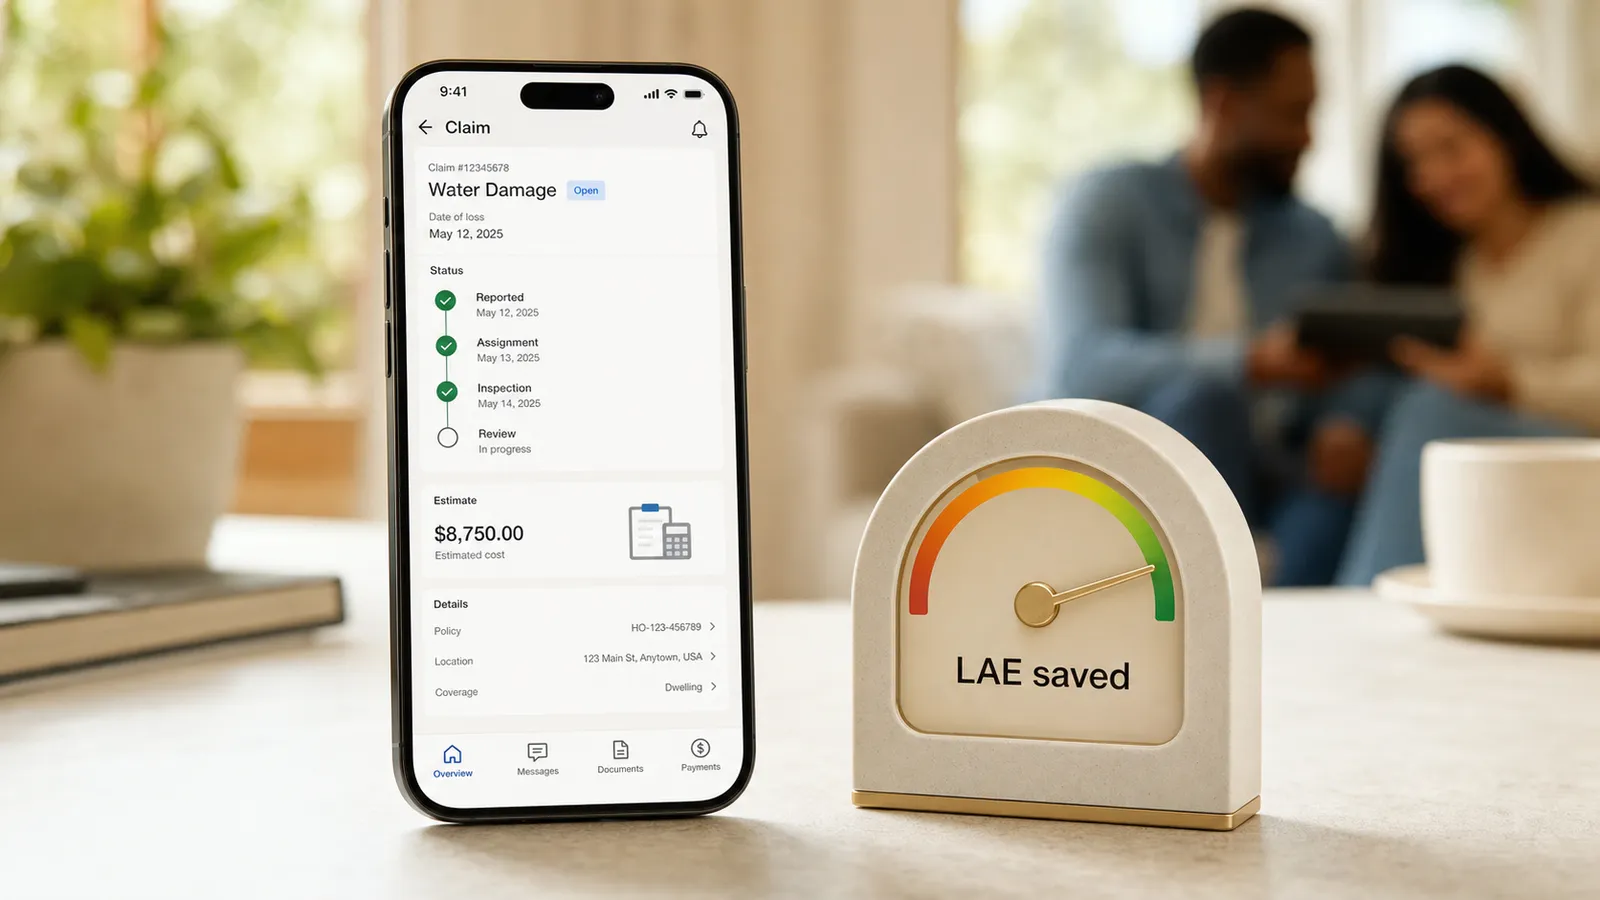
$1.2M average ACV per carrier against a $220K fully loaded CAC, gross-profit payback in about three months.
MK 04 / 10
Total Addressable Market
Claims-automation software spend compounding double digits (2025 to 2029), source: US P&C LAE and insurtech-software estimates
Bottom-up from US P&C LAE, 2025
Bottom-up from the US P&C LAE pool
Total addressable market = US P&C direct premium x LAE ratio x automatable share, summed across the lines
Line-by-line across the high-frequency P&C book
unit a = annual direct premium in the line; unit b = loss-adjustment-expense ratio; unit c = automatable share of that LAE
$42B
Auto, personal and commercial
Annual premium
$430B
LAE ratio
10.5%
Automatable share
46%
$21B
Property and homeowners
Annual premium
$280B
LAE ratio
10.5%
Automatable share
44%
$13B
Device, travel and small-commercial
Annual premium
$190B
LAE ratio
10.5%
Automatable share
40%
$8B
MK 05 / 10
Serviceable Addressable Market
$11B
$42B x 55% x 80% x 75% x 79% = $11B Serviceable Addressable Market
Filters applied to TAM:
Complexity: high-frequency, low-to-mid-complexity claims only - 55%
concentrates the pool on routine auto, property and specialty claims and excludes the complex long tail
Line: personal-lines and small-commercial where STP applies - 80%
excludes long-tail lines like injury and disability where straight-through processing does not hold
Adoption: carriers willing to use a third-party platform - 75%
excludes carriers committed to building and running claims automation fully in-house
Data: claims with digital FNOL and data for straight-through processing - 79%
excludes claims that cannot be captured or enriched digitally at intake
MK 06 / 10
Serviceable Obtainable Market
Our target in 5 years
$310M
| Year | tam unit a label | tam unit b label | tam unit c label | Total |
|---|---|---|---|---|
| Y1 | y1 unit a count | y1 unit b rate | y1 unit c value | y1 total |
| Y2 | y2 unit a count | y2 unit b rate | y2 unit c value | y2 total |
| Y3 | y3 unit a count | y3 unit b rate | y3 unit c value | y3 total |
| Y4 | y4 unit a count | y4 unit b rate | y4 unit c value | y4 total |
| Y5 | y5 unit a count | y5 unit b rate | y5 unit c value | y5 total |
Active users
MK 07 / 10
Industry Growth and CAGRDouble-digit growth in claims-automation software spend
US P&C LAE and insurtech-software estimates, 2025
US P&C LAE pool near $95B and at multi-year-high ratios post-2022 to 2024 severity shock | industry estimates
US claims-automation software spend compounding double digits through the decade | industry estimates
Policyholder claims NPS a persistent carrier weak point, driving app-grade expectations | industry surveys
Document AI and LLM adjudication now clearing the straight-through-processing reliability bar | industry estimates
MK 08 / 10
Market Challenges
Four real risks, each with a live mitigation
Carrier concentration
Seven carriers today, and the largest accounts carry real revenue weight while the book is still young
128% net revenue retention and a 16-carrier Year 1 plan diversify the book as it scales
Regulatory and model governance
Adjudication touches money and state insurance regulation, so a model error carries real liability
An FCAS-led governance function, human-in-the-loop review on the non-STP tail, and SOC 2 hold the line
Incumbent response
A CCC-style incumbent or an AI-native carrier could move on the routine-claim opportunity
Own the claim end to end across lines and compound carrier integrations before incumbents turn
STP coverage and adoption pace
The performance fee depends on lifting straight-through processing without loosening accuracy, and 41% is early
Deepen STP line by line with human-in-the-loop guardrails, targeting 61% by Year 3
MK 09 / 10
Key Takeaway
The routine US claim, owned end to end, priced on the LAE it saves

Total Addressable Market
$42B
Serviceable Addressable Market
$11B
Serviceable Obtainable Market
$310M
Compound Annual Growth Rate
12.0%

MK 10 / 10